Velocity has become the clearest sign of pitching’s evolution
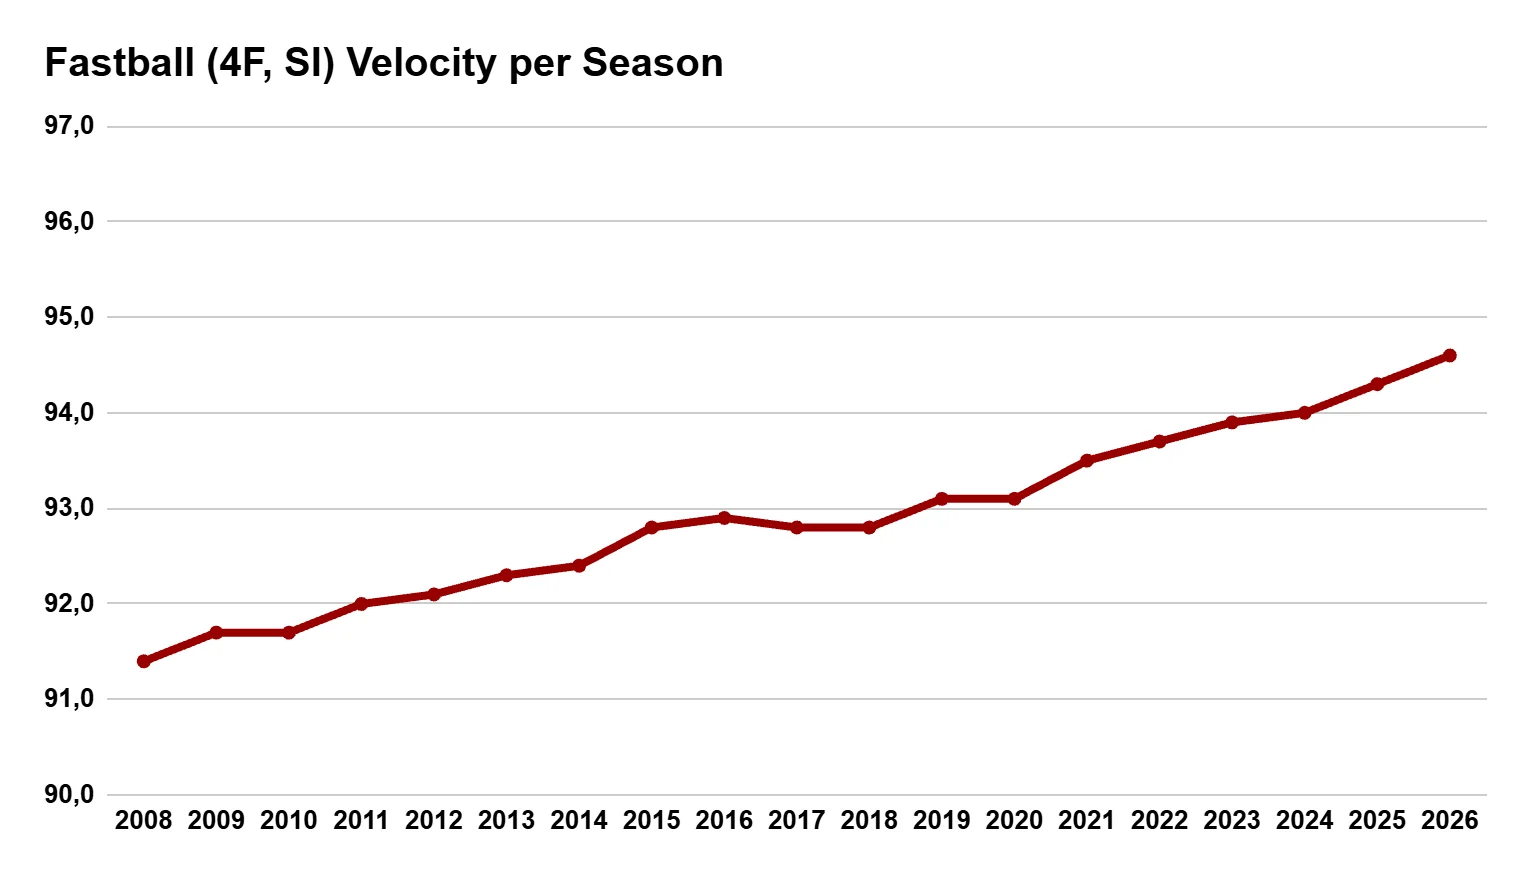
Major League Baseball’s pitching arms race has accelerated again. After a mid-2010s plateau, league-wide velocity jumped following the shortened 2020 season, and the average right-handed four-seam fastball reached 95.3 mph in 2026. That figure captures a visible change in how pitchers are trained and deployed, though it doesn’t explain by itself why the change happened or what it means for every pitcher. The rise matters because it’s one of the clearest signs of how quickly pitching development has changed.
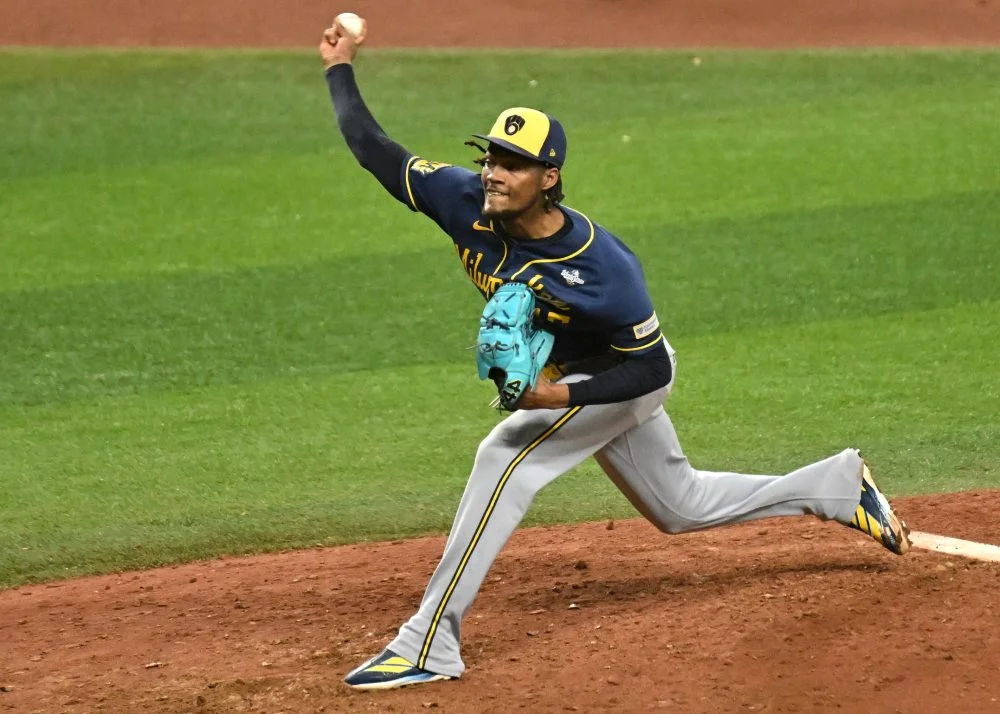
The latest postseason offered plenty to debate, from the American League’s uneven field to the National League’s deeper contenders. The 2026 World Series, which ended in five games, had the makings of a compelling matchup: Milwaukee and Tampa Bay were both pursuing their first title, with teams built around speed and run prevention. But the series itself didn’t deliver enough of the drama those ingredients suggested. That short finish leaves a useful opening to examine a development that reaches well beyond one championship: the steady rise in the speed of pitches across the sport.
MLB’s pitch-tracking data has been precisely measured and adjusted since 2008, making it possible to follow velocity over time. That record gives the trend a firmer basis than anecdotes about a particular pitcher or a memorable postseason at-bat. Still, a league average is a broad summary: it can show the direction of change without revealing how velocity is distributed among pitchers, or how individual roles and pitch choices shape the result. The broad direction is clear, but the path hasn’t been a smooth climb.
From steady gains to another surge
Velocity rose gradually in the early and middle 2010s, a period that also saw scoring fall. More relievers, wider use of data, and a deep talent pool all formed part of the picture. These factors help explain why velocity can’t be reduced to a single training breakthrough: teams’ pitching strategies, the pitchers available to them, and the information used to develop those pitchers all matter. The numbers then leveled off around 93 mph during much of the second half of the decade.
That pause overlapped with a steep decline in starting pitcher usage and the era of the juiced ball. The timing is suggestive, but it doesn’t establish a direct connection. Pitching changed substantially from 2009 to 2019, while teams were still only beginning to explore what modern data could contribute to development. In a period with several shifts happening at once, a chart can show that two things coincided; it can’t, on its own, tell us that one caused the other.
The pace picked up after the shortened 2020 season. In the last two seasons, velocity has climbed faster still. A 95.3 mph average for right-handed four-seamers is a striking marker, but it’s only part of the change: secondary pitches have also gained speed. That matters because a pitcher’s arsenal is a sequence of choices, not one headline number. A faster fastball may alter how a hitter reads the next pitch, while the value of that next pitch still depends on its movement, location, and the situation.
Fastballs aren’t the whole story
Sliders now average just under 88 mph. Curveballs have moved past a threshold that once seemed exceptional, clearing the 80-mph barrier and approaching 81 mph. Those figures suggest that the speed gains extend across pitch types, rather than showing up only in the fastball that draws the most attention. A curveball that’s harder than the older benchmark may also change how hitters judge the gap between pitches, though velocity alone doesn’t tell us how well any particular pitch works.
These numbers reflect more than pitchers throwing harder. Teams have refined their understanding of spin and pitch movement, then applied that knowledge to pitch selection and development. The aim is to make a pitch effective in context, not simply to chase the highest possible reading. Raw velocity makes the shift easy to see, but it sits within a broader effort to shape each pitch for maximum effect.
Here’s the thing: the numbers are impressive, but they don’t mean every pitcher is better simply because the radar reading is higher. A league average can’t account for command, movement, pitch mix, or how a pitcher handles a particular matchup. Those details are where the on-field value gets decided. This is more significant than it looks because the faster baseline changes what hitters face across the league, even when no single reading explains a whole performance.
The pressure behind the numbers
There’s a cost to that progress. Higher velocity can make pitching more difficult for hitters, yet the physical demands on pitchers make the trend a double-edged one. The data presented here doesn’t establish what those demands mean for health, and it wouldn’t support a simple conclusion about injury risk. It does show how much force has become standard at the major-league level.
(And this is the part most people overlook.) A rising average describes the pitches that are thrown, but it doesn’t show what organizations ask pitchers to do behind the scenes or how they balance speed with control and durability. The available figures offer a clear account of velocity, not a full explanation of the decisions that produce it. That distinction matters when reading the trend: the measurement is precise, while its causes and consequences require more evidence.
What the trend could mean next
The curve from the 2010s plateau to today’s faster pitches suggests that the next phase of pitching may bring more changes in both arsenal design and workload. The source data doesn’t say what those changes will be, and a continued rise shouldn’t be treated as guaranteed. Teams may keep refining how they develop and use pitches, but the figures here can’t tell us which methods will spread or how players will respond.
If you’re working in this space, the practical takeaway is to watch more than the fastball average: secondary-pitch speed is rising too, and the balance among pitches helps define how an arsenal works. For fans, the headline is simpler. Major-league hitters are facing a faster baseline, while pitchers and teams are still adapting to what that baseline demands. A league average above 95 mph is striking; what it means for the next stage of pitching will depend on how the sport manages the trade-offs that the number alone can’t settle. For now, the clearest takeaway is that velocity is still rising—and the league’s average fastball is already above 95 mph.